Surya Sashank GV

Financial Mathematics Graduate Student

My Story

Professional Me

Hello! I'm GV as aspiring Quant Trader/Developer. I currently work as a Quant at Flagstar bank. I completed my Masters from NCSU with Financial Mathematics. My goal is to build a successful career as a Quantitative Developer/Trader. With proficiency in Python, R, and C++, I possess a solid background in quantitative analysis and data-driven decision-making. I thrive on collaborative projects in Data Science, Deep Learning, and Quantitative Finance. My enthusiasm stems from the opportunity to apply mathematical models to tackle real-world financial challenges. I am dedicated to exploring innovative solutions that drive impactful results.

Language Stack

My favorite languages for programming, web automation, and data analysis.

Tools

The current Tech Stack I love using
Featured Projects

Sentiment Analysis

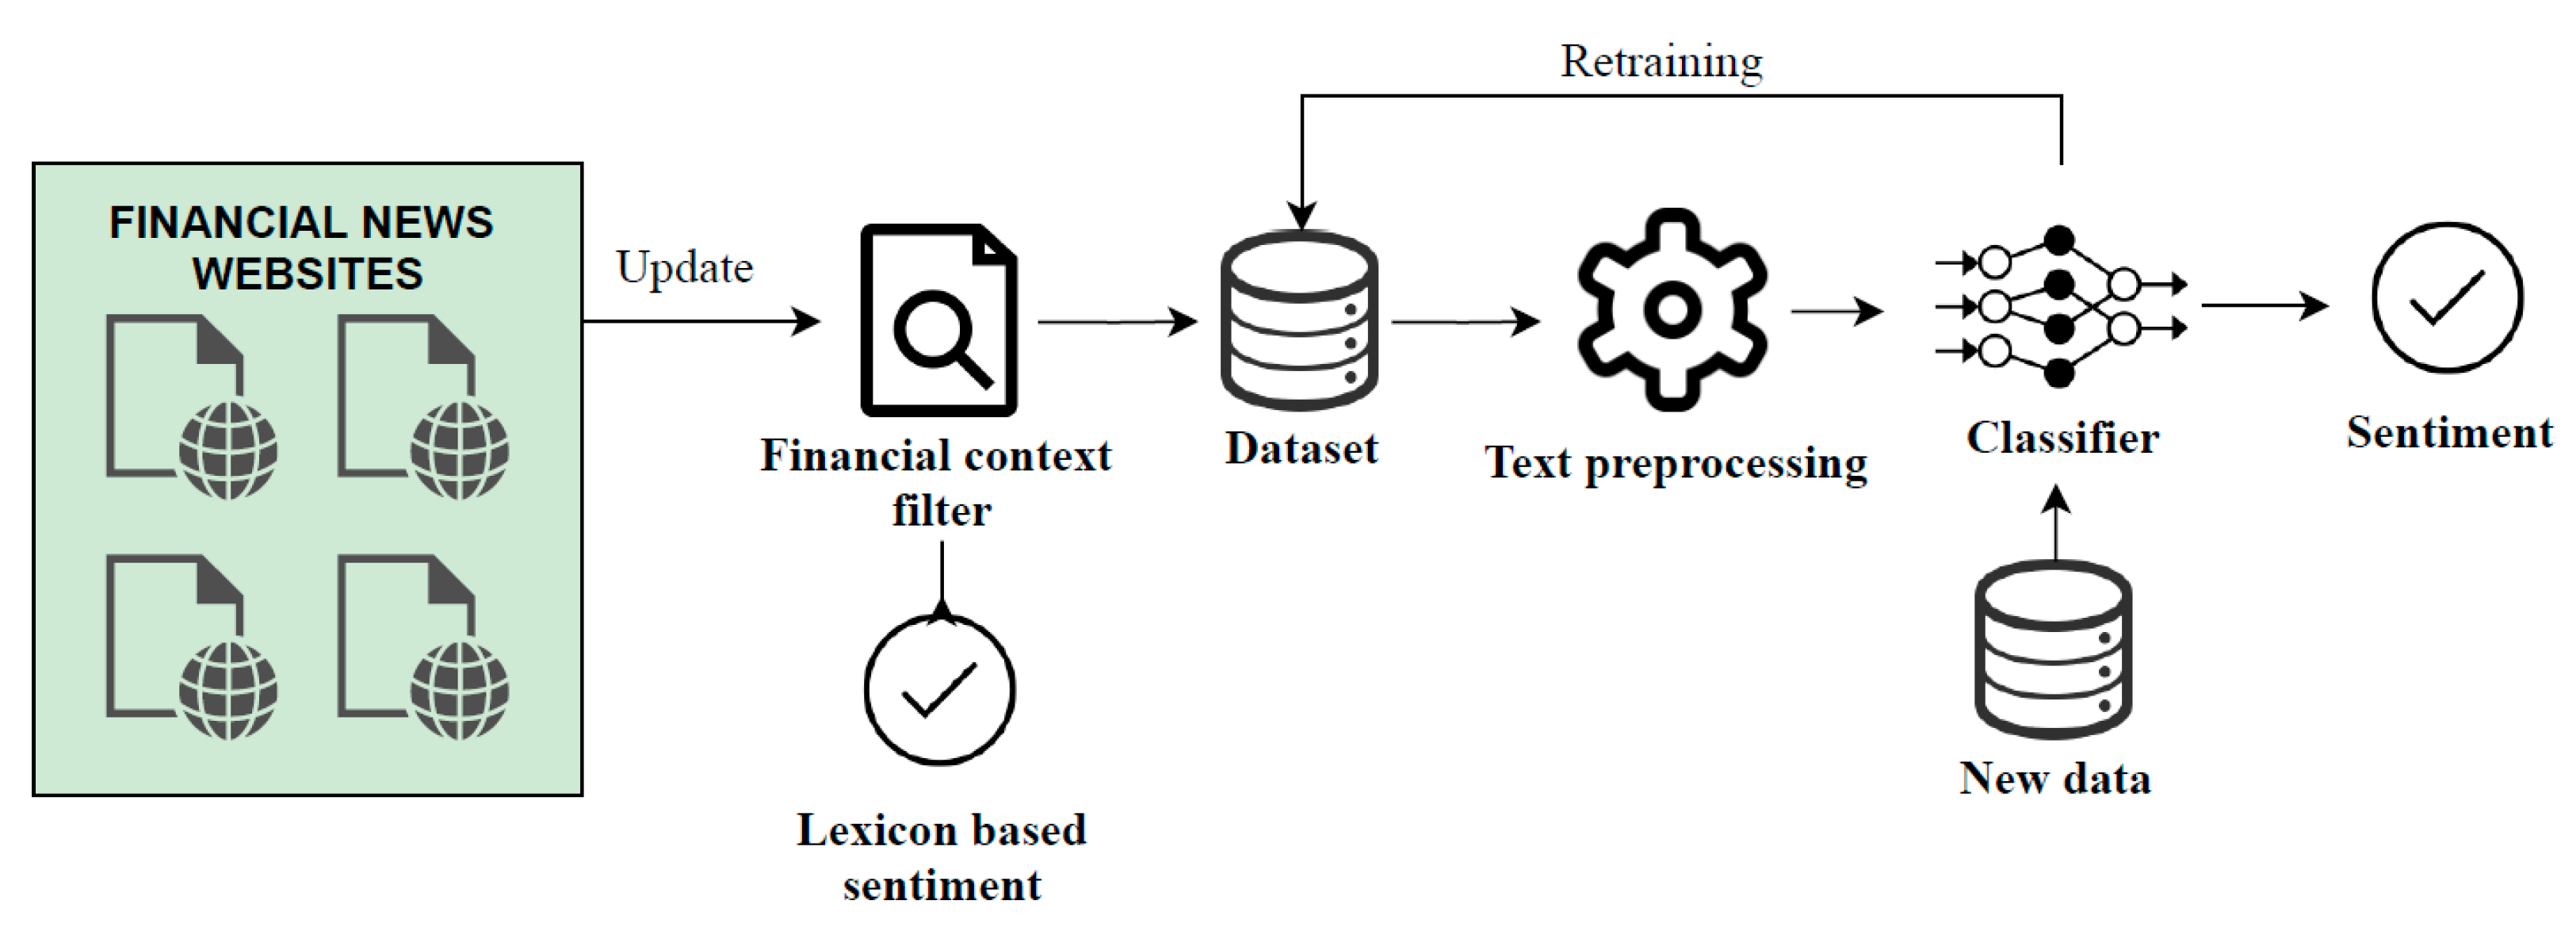
Sentiment Analysis for Event Driven Stock Price Prediction


In this project, our goal was to build a language/sentiment model capable of accurately predicting the sentiment of financial news headlines and providing insights into the market's direction. We achieved impressive results with a model that attained a loss of 0.11, an accuracy of 0.96, and an F1-score of 0.94, outperforming our baseline models.

View Details
Pairs Trading

Pairs Trading


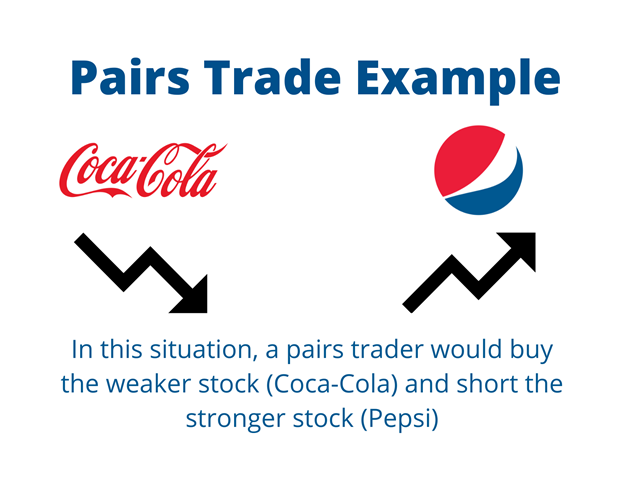
Statistical Arbitrage or StatArb “is a class of short-term financial trading strategies that employ mean reversion models involving broadly diversified portfolios of securities (hundreds to thousands) held for short periods of time (generally seconds to days). A pairs trade is a trading strategy that involves matching a long position with a short position in two stocks with a high correlation. Within this project I explored the financial sector for any pairs available in the US market. I then created trading signals and the backtested the code to find the CAGR of the trades.

View Details
Web Application for Visualizing Technical Indicators using Python

Visualizing Technical Analysis using Python and Plotly Dash


With this web application I aim to provide a free open source method for people to visualize and understand various technical indicators. People can use this application to select various technical indicators and then visualize and interact with them. This can help new financial engineers get a better understanding of how various parameters of a technical indicator will affect the way we execute trades. It uses the technical analysis library available for python and Plotly's interactive visualization tools to provide the user with a dynamically changing and interactive tool.

View Details
Credit Risk Using R

R Markdown Report on Credit Risk Data


Within this project I aim to first pre-process the data into both user readable and machine readable format, explore the data and derive inferences, and finally use this to predict whether if a person will default their loan or not.

View Details
Portfolio Optimization Using R

Portfolio Optimization Using R


This is second web application I had deployed using RStudio and shiny. It uses Performance Analytics and Portfolio Optimization to reduce a user's risk and gives them the optimal percentage weight of each stock in their portfolio. This is a reactive application and can be used on any device.

View Details
Collatz Conjecture

Visualizing Collatz Conjecture Using R Programming


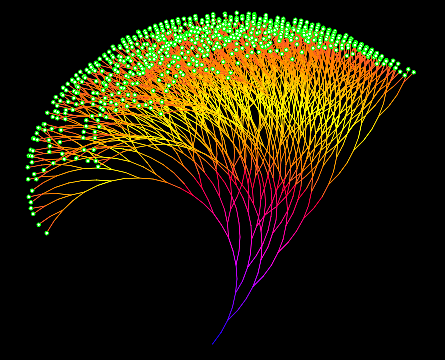
This is my first shiny application. I started out learning R programming at the end of 2020 and wanted to deploy data science projects or financial analysis tools as a web application. Recently, I came across the Shiny package in R and wanted to start working with and deploy a basic and interactive line plot. I plotted the movement of the Collatz Conjecture for various inputs from the user. The graph also allows the user to zoom in and see the values at various parts of the graph.

View Details
Flight Delay Prediction Project

Flight Delay Prediction


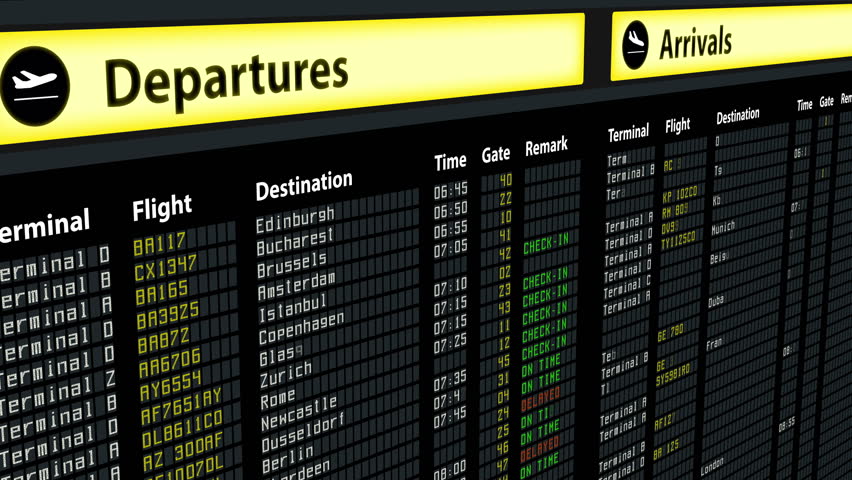
During my time at Solarillion foundation as a Research Assistant I built a two-stage machine learning model that uses data from over 15 domestic flights to predict if a flight will arrive late or not and in case it has been predicted to arrive late it will predict the delay in minutes.

View Details
Online Certifications and Courses

Online Certifications and Courses

The pandemic in 2020 had given me time to explore my interests and learn more about the fields of statistics, mathematics and data science. With help from my university I completed nearly 35+ courses in Machine Learning, Deep Learning, Data Science and Finance. You can view a list of certifications along with their credentials below

View Details